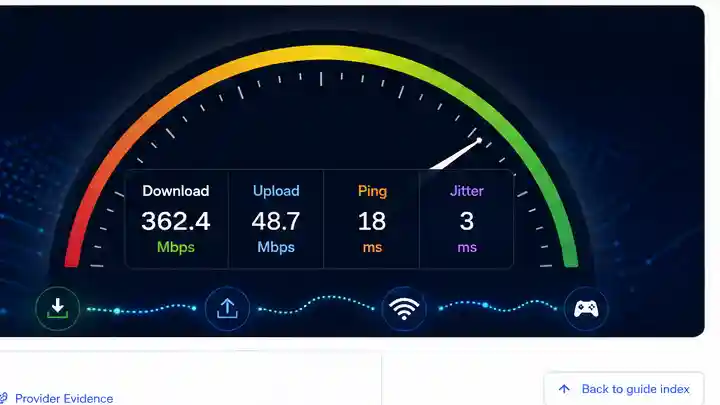
This internet speed guide explains download speed, upload speed, ping and jitter so you can choose the correct next step without confusing Wi‑Fi limits, device caps, router queueing and provider faults.
Internet speed test results
Understand download, upload, ping and jitter
A single Mbps number cannot explain every broadband problem. Use the clean test below, then match the failed metric to Wi‑Fi, device, router-load or provider evidence before changing hardware or packages.
Use your latest Mbps result to decide whether the issue is simply lack of capacity or whether the next test should focus on Wi‑Fi, loaded latency or provider routing.
Bandwidth headroom calculator
Enter a recent speed-test result, then choose the activity profile that best matches the household. The output tells you whether the raw capacity is comfortable, borderline or unlikely to be the main fault.
Tip: use the same device and server conditions for fair comparisons.
Ready to analyse
Enter a measured speed to see whether your result looks comfortable, borderline or likely to bottleneck your use.
When this tool helps most
It is useful when a speed result looks “fine” on paper but the household still struggles. The calculator separates raw capacity questions from the deeper fault boundary.
Comfortable headroom: focus on Wi‑Fi, device limits, jitter or loaded latency instead of buying a faster package immediately.
Borderline headroom: pause background traffic and compare quiet versus busy results before changing settings.
Very low headroom: the line may simply be saturated for the way the home uses it.
Streaming mismatch: if a service-specific test such as Fast.com is much lower than the main LinkSpeed speed test at the same time, compare both before blaming Wi‑Fi alone.
Keep the device, test server and browser conditions consistent. Change one variable at a time so the result proves where the limit sits.
1
Pause background traffic
Stop downloads, cloud backup, CCTV uploads, software updates and other speed tests.
2
Test beside the router
Use a modern device and record download, upload, ping and jitter from the same test.
3
Repeat over Ethernet
Use a known-good cable where possible. Confirm the wired link is 1 Gbps rather than 100 Mbps.
4
Test where the problem happens
Repeat on the affected device or in the slow room without changing the server.
5
Compare quiet and busy conditions
Retest while the household is active and note whether ping, jitter or upload changes sharply.
Browser check: if one older device reports unusually low speeds, retry in a private window with extensions disabled or compare another modern device. Browser CPU limits can distort high-speed tests.
What download, upload, ping and jitter actually measure
↓ MbpsBulk data reaching your device
Download speed
How quickly data reaches your device. It affects streaming quality, large downloads, app updates and how many people can consume content at once.
When poor
Streams reduce quality, downloads take longer and several users compete for limited capacity.
Check next
Compare Ethernet, package speed, device limits and peak-time patterns. For package speed, router sync and wired link-rate diagnosis, continue to the slow broadband line-rate guide.
↑ MbpsData leaving your device
Upload speed
How quickly your device sends data out. It affects video calls, backups, CCTV, livestreaming and file sharing.
When poor
Other people report frozen video, cloud backups crawl and the connection may lag while uploads are active.
The round-trip delay to a server. Lower is better for gaming, voice calls, remote desktops and other interactive services.
When poor
Controls feel delayed, voice conversations overlap and interactive services respond slowly even when download is fast.
Check next
Compare Wi‑Fi and Ethernet, disable VPNs for the test and continue to the high-ping troubleshooting guide for route, line and loaded-latency diagnosis.
≈ msVariation between packet delays
Jitter
The variation between packet delays. High jitter can create call dropouts, robotic audio, stream stutter and gaming micro-freezes even when average ping looks acceptable.
When poor
Packets arrive unevenly, forcing calls, games and live streams to buffer or conceal timing gaps.
Check next
Compare Wi‑Fi and Ethernet, repeat at quiet and busy times and read what jitter means for the deeper metric explanation.
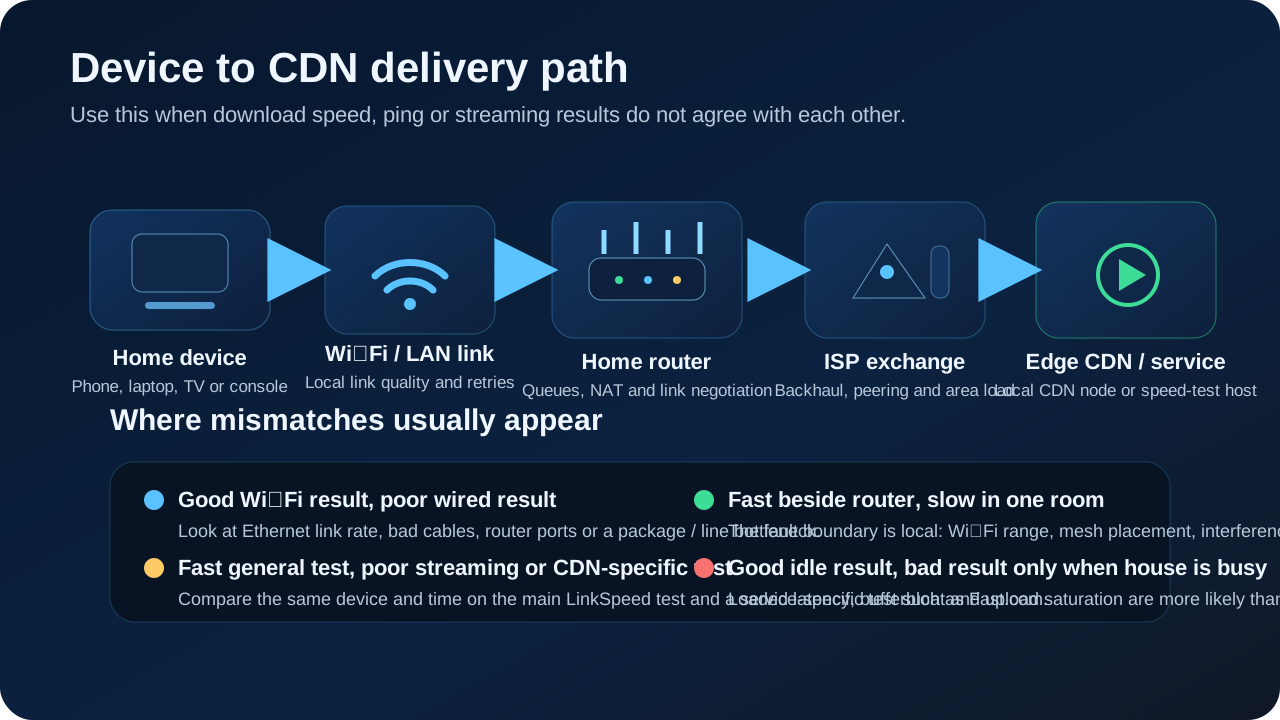
See the path from your device to the content server
This diagram shows why one speed result can disagree with another. Traffic does not only travel between your device and the router; it continues through the ISP exchange and on to the edge server or CDN host that actually serves the content or test file.
Home link
Weak Wi‑Fi, retransmissions, a 100 Mbps wired link or a busy router can distort the result before the traffic ever leaves the house.
Access line and backhaul
If wired tests fall below the package speed at the same quiet times, look at the router sync, line profile or local exchange congestion.
Edge CDN or service path
If a streaming-specific test such as Fast.com is consistently lower than the main LinkSpeed speed test on the same device and time, compare both before blaming local Wi‑Fi. That mismatch can point to peering, CDN selection or app-delivery issues.
These are practical reference ranges, not contractual guarantees. Your package, server distance and access technology matter more than one universal number.
Swipe horizontally to view all table columns →
Metric
Strong result
Usable result
Investigate when
Download
200 Mbps or more for busy multi-user homes
30–200 Mbps for typical streaming and browsing
Repeated wired results are below the expected package range
Upload
20 Mbps or more for frequent calls, backups and sharing
5–20 Mbps for ordinary calls and light uploads
Calls fail, uploads crawl or loaded latency rises sharply
Idle ping
Below 20 ms to a nearby UK server
20–40 ms can still feel responsive
Wired ping stays high when the connection is quiet
Jitter
Below 5 ms
5–15 ms may be acceptable
Voice, video or games stutter and the figure varies widely
Loaded latency
Small increase above idle
Moderate rise under heavy load
Ping jumps by tens or hundreds of milliseconds during transfers
Inspect loaded latency and queue behaviour without overwhelming casual users
Use this only when ordinary Wi‑Fi, device and Ethernet comparisons do not explain why the connection becomes unstable under load.
Advanced: OpenWrt SQM, qdisc backlog and CPU checks
First identify the real shaped interface. Do not assume that every installation uses pppoe-wan or the same IFB name.
Identify SQM and active queue disciplines
uci show sqm
ip link show
tc qdisc show
OpenWrt active-queue qdisc backlog audit
tc -s -d qdisc show dev pppoe-wan
tc -s -d qdisc show dev ifb4pppoe-wan
Compare CPU and network-processing load
top
cat /proc/softirqs
cat /proc/interrupts
Interpretation: persistent backlog with rising loaded latency can indicate incorrect shaping or another unmanaged queue. Controlled AQM drops or ECN marks are not automatically faults. Low backlog with collapsing throughput points more strongly to CPU, driver or offloading limits.
This page defines the counters and identifies the fault boundary. For upstream saturation and queue-management tuning, continue to the slow upload guide. For CPU, offloading and SQM capacity, use the router SQM and hardware-acceleration guide.
Build evidence only after Ethernet removes the local variables
Collect a repeatable wired baseline
Use the same modern device, Ethernet cable and test method. Record time, download, upload, ping and jitter across several tests.
Confirm the link is not capped locally
Verify the Ethernet link is 1 Gbps or faster. A 100 Mbps negotiation will usually cap real throughput near 90–95 Mbps.
Compare package and line information
Record the package, expected range, minimum guarantee where applicable and router sync or line rate before contacting support.
Describe the fault precisely
Tell the provider whether the issue is low download, low upload, high idle ping, high jitter or peak-time degradation rather than reporting only “slow internet”.
Escalate when: repeated Ethernet results remain below the expected or guaranteed range with background traffic paused, or the same line-level problem appears across multiple devices and times.
Why is my download speed good but gaming or calls still lag?
Download speed measures bulk bandwidth capacity. Gaming and video calls depend more on low idle ping, low jitter and stable loaded latency, so a fast connection can still lag when router queues fill or packets arrive unevenly.
Why are Wi‑Fi and Ethernet speed test results different?
Wi‑Fi is a shared half-duplex radio medium affected by distance, obstructions, interference and retransmissions. Ethernet removes those radio variables, although a 100 Mbps port or damaged cable can still cap a wired result near 90 to 95 Mbps.
What is a good ping and jitter result?
Lower and consistent is better. For many UK connections, idle ping below 20 ms and jitter below 5 ms are strong results, but server distance and access technology can make higher figures normal.
When should I contact my broadband provider?
Contact the provider when repeated Ethernet tests remain below the expected or guaranteed range with household traffic paused, or when the same line-level problem appears across multiple devices and times.
Download speed is only one part of connection quality. Pair it with upload, ping, jitter and packet-loss checks when calls, gaming or interactive apps feel poor.