Idle baseline
Ten small requests estimate normal latency while the connection is relatively quiet.
Measure how much your latency rises when the connection is busy. A fast line can still feel laggy if downloads, uploads or cloud backups make ping soar.
Free connection-quality test
The LinkSpeed test measures a quiet baseline, then checks latency during separate download and upload loads. It grades the worst added delay—not just raw speed.
About 25 seconds · Significant data use · No installation required
Connection quality test
This test first measures idle ping, then creates download and upload traffic while continuing to measure latency. The difference is your added latency under load.
Before starting: use Ethernet for the clearest router/line result, pause other heavy traffic and avoid running the test on a limited mobile-data allowance.
Ready to test.
This is a browser-based estimate, not a laboratory measurement. Wi-Fi interference, VPNs, browser load, other users and the route to the test server can affect the result. Try two or three tests before changing equipment.
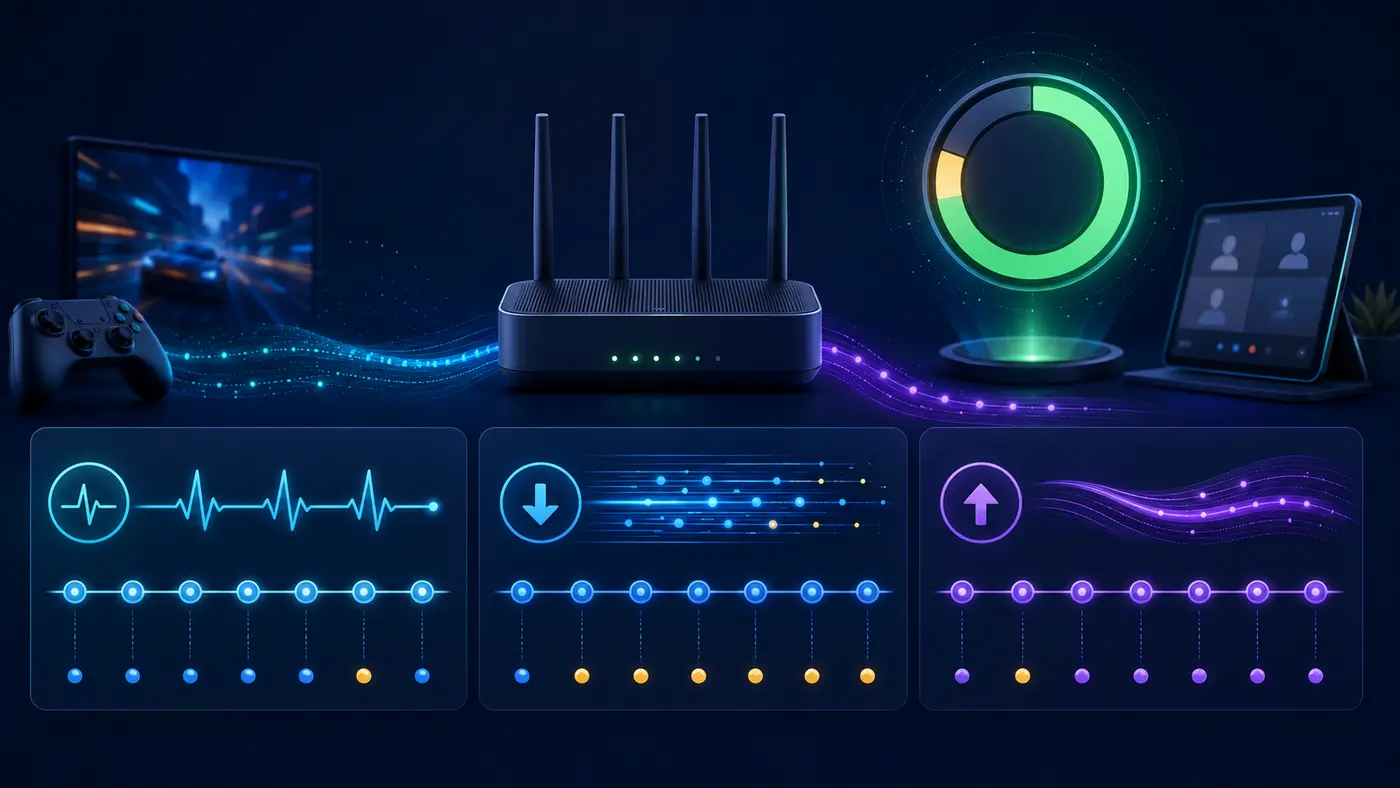
Three-phase measurement
Ten small requests estimate normal latency while the connection is relatively quiet.
Parallel download traffic fills the downstream path while latency samples continue.
Upload traffic fills the upstream path—often the easiest direction to saturate.
The test subtracts idle latency from each loaded result and grades the worst increase.
The test deliberately places the connection under pressure. It may use a significant amount of data on fast services, so avoid limited mobile allowances and do not run it while other people need the connection for an important call.
Focus on the increase above idle latency, not simply the largest ping number. If idle latency is 20 ms and loaded latency is 35 ms, the increase is 15 ms. If it jumps to 180 ms, games and calls may become noticeably sluggish whenever somebody uploads photos, downloads a game or starts a cloud backup.
| Added latency | LinkSpeed rating | Likely experience |
|---|---|---|
| 0–5 ms | A+ Exceptional | Responsiveness changes very little under load. |
| 6–15 ms | A Excellent | Well controlled for gaming, calls and mixed household use. |
| 16–30 ms | B Good | Usually comfortable, with occasional small delays. |
| 31–60 ms | C Fair | Lag may be noticeable when the line is busy. |
| 61–120 ms | D Poor | Games, calls and interactive apps may struggle under load. |
| Over 120 ms | F Severe | Heavy traffic is likely to cause obvious delay. |
These bands are LinkSpeed guidance rather than an industry certification. A low grade does not identify the exact cause; it shows that responsiveness deteriorated during this test.
Broadband speed describes how much data can move each second. Latency describes how quickly a small request receives a response. Large queues in a router, modem or network can keep bulk transfers moving while making smaller time-sensitive packets wait.
| Result pattern | Likely interpretation | Next check |
|---|---|---|
| Upload added latency is much higher | The smaller upstream capacity is easy to saturate. | Pause backups/CCTV and prioritise upload shaping. |
| Download added latency is much higher | The downstream queue or ingress path is not being controlled well. | Check router SQM download settings and modem/router topology. |
| Both loaded results are high | The router may lack effective queue management in both directions. | Enable SQM/QoS, leave headroom and retest. |
| Ethernet good but Wi-Fi poor | The broadband queue is controlled, but wireless adds delay. | Improve signal, channel use, mesh placement or backhaul. |
| Idle latency is already high | The problem is not solely bufferbloat under local load. | Check VPN routing, 4G/5G signal, provider routing and server distance. |
| Results change by time of day | Available capacity or congestion may be varying. | Test morning and evening; shape for the stable busy-time rate. |
It normally completes in about 25 seconds: first an idle baseline, then approximately eight seconds each of download and upload load, plus transitions.
Start with Ethernet where possible. Then repeat on Wi-Fi. If Ethernet is good but Wi-Fi is poor, investigate signal strength, interference, mesh placement or the wireless device rather than immediately blaming the broadband line.
Many UK packages have much less upload capacity than download capacity, so uploads are easier to saturate. Photo backup, CCTV, file sharing and livestreaming may fill that smaller upstream queue.
More capacity can make saturation less frequent, but it does not guarantee good queue management. A correctly configured router can sometimes improve responsiveness more than a headline speed upgrade.
Yes. Full fibre can provide high capacity and low idle latency, but queues can still grow when the service or router is saturated—particularly on the upload side.
Browser timing, network routes, Wi-Fi and underlying capacity vary. Two or three comparable runs provide a more reliable picture than one unusually good or poor result.
No. The test shows that latency rose under load, not exactly where the queue formed. Compare Ethernet and Wi-Fi, router settings and different times before drawing a conclusion.